
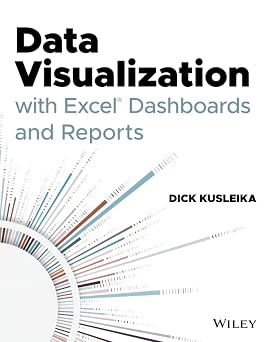
Data Visualization with Excel Dashboards and Reports
Data Visualization with Excel Dashboards and Reports
Large corporations like IBM and Oracle are using Excel dashboards and reports as a Business Intelligence tool, and many other smaller businesses are looking to these tools in order to cut costs for budgetary reasons. An effective analyst not only has to have the technical skills to use Excel in a productive manner but must be able to synthesize data into a story, and then present that story in the most impactful way. Microsoft shows its recognition of this with Excel. In Excel, there is a major focus on business intelligence and visualization. Data Visualization with Excel Dashboards and Reports fills the gap between handling data and synthesizing data into meaningful reports. This title will show readers how to think about their data in ways other than columns and rows. Most Excel books do a nice job discussing the individual functions and tools that can be used to create an "Excel Report". Titles on Excel charts, Excel pivot tables, and other books that focus on "Tips and Tricks" are useful in their own right; however they don't hit the mark for most data analysts. The primary reason these titles miss the mark is they are too focused on the mechanical aspects of building a chart, creating a pivot table, or other functionality. They don't offer these topics in the broader picture by showing how to present and report data in the most effective way. What are the most meaningful ways to show trending? How do you show relationships in data? When is showing variances more valuable than showing actual data values? How do you deal with outliers? How do you bucket data in the most meaningful way? How do you show impossible amounts of data without inundating your audience? In Data Visualization with Excel Reports and Dashboards, readers will get answers to all of these questions. Part technical manual, part analytical guidebook, this title will help Excel users go from reporting data with simple tables full of dull numbers, to creating high-impact reports and dashboards that will wow management both visually and substantively. This book offers a comprehensive review of a wide array of technical and analytical concepts that will help users create meaningful reports and dashboards. After reading this book, the reader will be able to: Analyze large amounts of data and report their data in a meaningful way Get better visibility into data from different perspectives Quickly slice data into various views on the fly Automate redundant reporting and analyses Create impressive dashboards and What-If analyses Understand the fundamentals of effective visualization Visualize performance comparisons Visualize changes and trends over time Published By John Wiley & Sons on 2021-02-17
Book Specifications
Book Title
You are viewing an alternative format/edition for this title. You can proceed directly to this book's page to complete your purchase.
More Books By Dick Kusleika
People who bought this also bought

Rules for Radicals: A Pragmatic Primer for Realistic Radicals book by Saul D. Alinsky
The Power Broker: Robert Moses and the Fall of New York book by Robert A. Caro
Hacking Growth: How Today's Fastest-Growing Companies Drive Breakout Success book by Sean Ellis , Morgan Brown
On-The-Level: Performance Communication That Works book by Patricia A. McLagan
The New Webster's Library of Practical Information: Spelling Dictionary
Vital Friends: The People You Can't Afford to Live Without book by Tom Rath
Greenspan's Bubbles: The Age of Ignorance at the Federal Reserve book by William Fleckenstein
The Girl with Seven Names: Escape from North Korea book by Hyeonseo Lee
The How: Notes on the Great Work of Meeting Yourself book by Yrsa Daley-Ward
Getting to Yes : Negotiating an agreement without giving in book by Roger Fisher
NKJV, Precious Moments Holy Bible, Hardcover, Pink: Small Hands Bible By Thomas Nelson
A Call to Conscience: The Landmark Speeches book by Clayborne Carson